using react-chartjs to create a clickable bar chart
chartjs is a popular (58k github stars) charting library which supports many different kinds of charts
react-chartjs is a wrapper for chartjs for react apps. It provides a number of components such as Bar which are easy to use to create charts.
I used react-chartjs 2 days ago to create a clickable bar chart for our hackathon project and it's pretty freaking awesome.
I have 1 simple dataset and needed each bar to be clickable. Took less than 2 hours to use react-chartjs and learn how to get it working. Others on the team were using D3 and that has a much steeper learning curve (although very powerful).
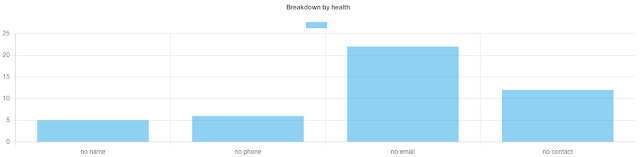
Here's what my chart looks like. Each bar is clickable and calls an onClick handler I passed to the Bar component.
I followed this react-chartjs example but had just 1 dataset (instead of 2 as in the example).
Here's a gist of the code (I modified a larger file so apologies for any mistakes) which has what you'll need to get it setup and working.
Comments
Post a Comment